Statistics are important tools to provide information for people. Furthermore, they are evidence that can effectively strengthen any argument and persuade the audience to change their opinions. However, statistics can be twisted into negative ways. Statistics are often used in wrong ways. Therefore, statistics should be interpreted with caution as they can be misleading; they can both lie and tell the truth. This essay will illustrate the following six main important points that lead to misleading statistics: unreliable sources, Internet surveys, misleading graphs, incomparable samples, biased questions and manipulated statistics.
EAP 5: 5:30- 8:00
(Tue-Thu)
Unreliable Sources
Statistics
are crucial in many ways. However, misusing and misunderstanding statisticshave
the potential to influence decision-making and the accuracy of prediction or judgment
of users. Therefore, before deciding whether the statistics are reliableor not,
a critical analysis is always necessary. Although the Internetis widely known
to be capable of offering a great wealth of information that could be
beneficial for research and assignments, users should always notethat not every
site offers accurate information. Some sources are reliable and some are not.
Therefore,
before going further to talk about the form of unreliable sources, the definition
should be provided. Unreliable sources aredocumentsthat are written by unknown authors
who have no proper status, improper background, and unknown qualifications
(Austin Peay State University Academic support center writing lab, unknown
year).Moreover, anyone either an expert or an amateur can post anything on the Internet.
Writers just writebased on their perspectives on some particular issues such as
the environmental issues, political or other issues without any precise
citation. Wikipedia, blogs, Tweeter, forums, personal websites, andquestionable
sites are some of the examples of unreliable sources.Furthermore, some sites
like Wikipedia allow users to post or edit articles freely. Therefore, those
sources are not reliable and appropriate to use for research purposes. In prior
to uploading a document on the Internet does not require editors, fact checkers
or reviewers to ensure the accuracy and evaluate the work (Kranendonk, 2013).
Additionally, a date that can be seen on a website could be the date posted,
date edited, or there might not be a date included. Hence, appropriate steps
should be carefully analyzed before determining the reliability of a source.
Factually,
sometimes writers just write based on their own assumption or the general assumption
that could be too general or unspecific to predict the other new case study.
For example, the number of cigarettes that have been sold on the market can
estimate by counting the number of people smoke the cigarettes. However,
sometimes the number of cigarettes has been smuggled by the illegal importer to
sell in the country without paying the tax, so the government cannot control on
this point. Furthermore, in some cultures, the women smoke even more than the
men do, but the data tends to provide or state that the men smoke more than the
women based on the general assumption.
Hence, the general information that is always right and reliable does
not guarantee it is one hundred percent accurate in every case. (Pijahn, 1996)
In
addition to this, some sources offer misleading information as a form of
persuasive or deceptive strategy. According to Derbyshire,misleading
advertisements attract people, especially housewives,to buy various kinds of
products or services. For instance, Colgate claims in its advertisement that
its toothpaste is highly recommended by 80 percent of dentists, and it appears
to people that the toothpaste is suggested to use by 80 percent of dentists
globally. While in fact, it is shown to be a false slogan, since the surveys of
dentists and hygienists were based on telephones, and carried out by the
manufacturers (Derbyshire, 2007). Therefore, not every advertisement and
statistics shown on television, poster, or advertisement is reliable.
Onthe
other hand, a reliable source that has information which is expired or not
updated can also be misleading. Every source needs to be updated recently in
order to keep up to precise and latest true stories. As time goes by,
everything–environment, population, culture, belief, technology, society,
governments and more–changes, eitherbetter or worse. If a source provides the
information that was surveyed in 1999—the information would only focus on the
1999’s situation, not in the next year or next period of time. For instance,
according to the United Nation
website, the world population of developed regions in 1999 was 5,978,401
thousand people. However, in the next year (2000), it rose dramatically up to
6,055,049 thousand people (United Nations, unknown years). This example
illustrates precisely of how big the difference between the old source and
up-to-date source is.
However,
some reliable sources can be misleading as well. The information that is
offered could be either too exaggerated, or have half of the overalldetails
omitted to achieve a certain purpose. For example, making people feel good
about a particular area or deceivingpeople into doing something. Another example,
the government website which reports the development of the country in a
certain area would want people from all over the world to know that it is
developing to attract more investors and tourists. Whereas, in the
occasionswhere there is a war or disaster, authorities could also omit
information to calm people down. Therefore, reliable sources can sometimesoffer
inaccurate information to benefit themselves.
To sum
up, statistics can be very beneficial for assignments and research. However,
not all of the sources are reliable. Numbers are powerful and so are
statistics. Statistics can be persuasive pieces of evidence that is used to
effectively prove arguments. Therefore, if not used carefully, it can fail to
make arguments on something transparent and reliable, yet ambiguous
(Statistics, nd.).Hence, information users should be aware of the misleading
information to avoid making wrong decision, unfair judgments and predictions.
Bibliography:
Austin Peay State University Academic support
center writing lab, Reliable and Unreliable Sources. (Unknown Year) . Retrieved
from http://www.apsu.edu/sites/apsu.edu/files/academic-support-center/Reliable_and_Unreliable_Sources.pdf
Author unknown, (nd.) Statistics[online].University
of North Carolina. Retrieved from:
http://writingcenter.unc.edu/handouts/statistics/
Derbyshire, D., (2007) ‘Colgate gets the
brush off for 'misleading' ads.’ The telegraph,17 January.
Kranendonk, Kees. (2013). Unreliable Sources. Academic English.
Pijahn, Y. (1996). No smoke without some unreliable
statistics. Retrieved from http://www.independent.co.uk/news/no-smoke-without-some-unreliable-statistics-1309461.html
Statistics
Should Be Interpreted With Caution As They Can Be Misleading
Survey
is a statistical study of a sample population by making enquiries about opinions,
perspectives, preferences and the other aspects of the individuals. Conducting web
survey is certainly common in everyday life, because many organizations and
companies believe that they will get many responses from the global community.
Population
is a major factor for inaccurate data in the Internet surveys. Errors can occur
by using different sample sizes when the target population is surveyed. The main reason for sample sizes turns out to
be different is that there must be some parts of the population that were not
included in the sample. For example, the Internet users’ survey that is related
to personal computer usage is unlikely to be accurate while the total
population is a mixture between those who own and those who do not own personal
computers. In this case, it results in different sample sizes. (Ronald D.Fricker, 2008)
Additionally,
another form of misleading Internet surveys is measurement errors. Surveyors
must not expect honest answers from the respondents. Answering sensitive
questions is a hard task for respondents. For instance, in Canada, questions
related to personal background such as salary, are just too sensitive that the
respondents may give dishonest answers. Misleading statistics on the Internet could
happen due to the lack of work and effort of those surveyors that do not use
the special programs to increase the accuracy of the survey. It means that the
surveyors can get many opinions from the respondents but the answers are just
multi-responses of one respondent (Ronald D.Fricker, 2008). In this situation,
people who are enthusiastically interested in the results of the surveys are
willingly to do the survey more than once in order to influence the results as
well as the statistics. For example, some people would create multiple email
accounts and do the survey several times when the website requires individuals
to sign up and participate. And, if one computer cannot access to the survey
more than once, they might probably use another computer to access and complete
the survey as much as they want. (Duda,
2010).
Moreover,
non-responses bias is introduced as another main cause of misleading
statistics. Non-responses bias influenced the survey results when a large amount of people in the sample
population reject or fail to respond and have relevant characteristics that are
different from those who respond. According to Field Epidemiology
Manual, some people do not respond
because they refuse or probably they cannot be contacted (Field Epidemiology Manual,
Non-response Bias).
Furthermore,
financial benefits are also regarded as one of the major factors for misleading
statistics. In facts, there is no quality control in web surveys. As Responsive
Management team stated, profits are offered if people volunteer to participate
in the survey for an organization or a company (Duda, 2010). Those profits include monetary, special
rewards or incentives, discount on purchases and gift certificates. By using
this procedure to encourage people to participate, the data information from
web survey results are completely misleading.
Typically,
after the surveys are conducted, the results are calculated and presented to
the public by using diagrams like tables, graphs and also charts. In this case,
misleading graphs can also be another huge impact on misleading statistics. Many
companies often use graphs to indicate or impress the customers with their
productivity and stock prices. Therefore, they need to make their graphs look
more interesting and attractive.
According
to Dr. Haney from Calvin College, approximately 73 years ago, some businessmen
created a type of graph called Gee-Wiz graph which is also known as a
misleading graph. A misleading graph is defined as a type of graph which is
converted from a normal graph to a more attractive one. In business, people
normally try to create various tricks or methods in order to attract customer
attentions (Haney).
There
are many different ways to create a misleading graph such as scaling and axis
manipulation, three dimensional effects (3D graphs) and deceptive pictographs (Misleading
Graphs and Statistics, Chapter 31). Firstly, in order
to mislead a graph using scaling and axis manipulation procedure, it is
necessary to adjust the scale of the Y axis to be longer than the scale of the
X axis. It can change the graph from a slight increase to a significant
increase. Secondly, 3D graphs can impress readers at first sight. This type of
graph looks more appealing, compares to a normal graph (2D graphs). Finally,
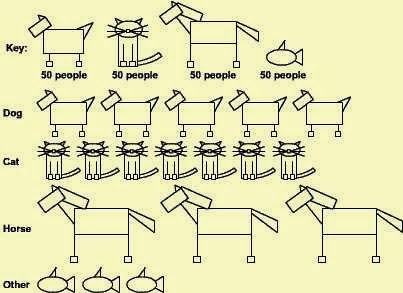
deceptive pictograph is also a common type of misinforming diagrams which
businessmen often use to deceive people ’eyes. Deceptive pictographs indicate a
different category with various sizes depends on their actual sizes. For
example, a pictogram indicates 4 kinds of domestic pets owned by people. Each
symbol illustrates a type of pet which is owned by 50 people. On the left
pictogram (Misleading graph), the actual size of the horse symbol is bigger
than the others. Whereas, on the right pictogram (Normal graph), the horse
symbol is represented in the same size as others (Misleading Graphs and Statistics, Chapter 31).

These
three types of misleading graph are quite common in the internet. Especially,
scaling and axis manipulation since it can easily trick the viewers and the
viewers rarely focus on the scale of the graph. But, they only focus on the
trend of the graph such as the declining and expanding. Therefore, misleading graphs is regarded as
one of the major causes of fallacious statistics.
(900
words)
Bibliography
Duda, M. &. (2010). Responsive
Management, The Fallacy of Online Survey. Retrieved 2013
Available from http://www.responsivemanagement.com/news_from/2010-05-04.htm
Field
Epidemiology Manual, Non-response Bias. (n.d.). Retrieved 2013
Haney, D. (n.d.). How To Lie With
statistics, Chapter 5, Increasing The Wow Factor. Retrieved November 2013
Available from http://faculty.nps.edu/rdfricke/docs/5123-Fielding-Ch11.pdf
Misleading
Graphs and Statistics, Chapter 31. (n.d.). Retrieved November 2013
Available from http://faculty.atu.edu/mfinan/2043/section31.pdf
Ronald
D.Fricker, J. (2008). Sampling Methods for Web and E-mail Surveys.
Retrieved 2013
Incomparable Samples
Statistics
are ways that people use numerical evidence to prove their studies. However,
statistics can be misleading if data is gathered wrongly. The major aspect that
leads people to misinterpret the statistics is incomparable samples. An incomparable
sample refers to a comparison between different sample sizes, genders, ages,
locations, living status and level of education.
First
of all, sample size is considered as one among other problems that mislead
people with the statistics. The size of sample could affect the margin of error
on the result. For example, a telephone survey with a sample of 100
participants produces less than 10 percent error, a sample of 500 participants
reduces the error margin to less than 4.5 percent, and a sample of more than
4000 participants almost reduce the error margin to just 1.5 percent (Scheuren,
2004). Therefore, the smaller the sample is the more error we will get. So in
order to obtain credible statistics, a larger sample is recommended.
In
addition, a comparison between unequal sample sizes can mislead people as well.
The size of the sample must be gathering equally when comparing the statistics.
Because when one sample has a smaller or a larger size compared to the others,
it result in misunderstanding for the readers. For instance, a survey about the
airline’s complaints that published by the US News and World Report reported
that US airline has more complaints than the Alaska airline. However, due to
the difference in number of passengers, it makes the statistic unbalanced since
the survey was conducted with 252 passengers from the US airline while it was
carried out with only 13 passengers from Alaska airline (Alden,2005).
Secondly,
genders and ages also cause people to misinterpret the statistics. The gender
plays a very important role in misleading statistics. Since men and women that
live in different areas have different point of views, surveyors should
distinguish between male and female groups before doing surveys. Because some
survey are only suitable for certain group of people to participate. As a
hypothetical example, imagine that if marketers wanted to conduct surveys
related with cosmetic products, it would not logical to conduct it on men since
they have no interest in cosmetic products compares to women. In order to
acquire a survey that reflect the general opinion of people, surveyors have to
make sure that the percentage of male and female that participate in the survey
represents the percentage of the whole population (Survey Design, 2005,
Internet). If the statistic is obtained wrongly; meaning that the survey is
conducted by unrelated group of people, the figures can result in misleading.
Moreover, age is also one of the most essential factors in obtaining precise
data. Both men and women in different age groups tend to have dissimilar
interests, behaviors and perspectives. For that reason, every survey should not
be done voluntarily, but should be done by various groups of people to achieve
precise data.
Thirdly,
social status and level of education are very crucial for gathering accurate
information from the survey. Normally, rich people can afford a higher
education, and live in a luxurious lifestyle while poor people have a limited
education, rely on farming and lead a very simple life. So, between the two of
them, one can say that rich and poor people are completely living in a
different world and they tend to have different perspective. Consequently, when
obtaining the statistical evidence from the survey, it is really important to select
the right group of people because the result might turn out completely
different if the sample is chosen recklessly.
Furthermore,
balancing the right sample of society status is really essential in providing
people the true and the right understanding of the statistics. For example, one
statistical result showed that fluoride consumption by human beings can
increases the cancer rate. So comparing to people who did not take in fluoride,
the people with the consumption of fluoride have a higher chance of increasing
the cancer rate (Alden, 2005). This statistic is totally misleading because it
did not provide any clear information. Likewise, only wealthy people can afford
to consume fluoride due to its expensive price. As a result, it made the sample
biased since it did not carry out randomly and there are more factors that also
contribute to the increasing of cancer rate. Generally, wealthy people have
fancy and modern lifestyles, and they usually eat unhealthily. So when those
people are getting old, they are likely to have more diseases especially
cancer. As can be seen, by using inaccurate samples, the statistics can easily
be ruined and misinterpreted. Moreover, some people might use this as a tool to
benefit their own business by exaggerating the information.
Beside
knowledge and living status that were just mentioned; similarly, location also
stands as a main role in the statistical experiments. Nonetheless, the
researchers must be aware of the result as could be accurate or mistaken. Based
on the statistical evidences, different locations such as rural area or urban
area can provide different beneficial information. Nevertheless, the numerical
facts can be misleading when the sample is incomparable in some ways. For
example, there was a survey which was conducted by the American people,
questioned “Do you think the Obama administration has already cut the taxes
last year?” (Haney, 2011). The truth is that he really had cut the taxes, but
surprisingly there were more than 80 percent of people did not think so. The
reason behind this issue is that the people who took part in the poll did not
represent the whole population in America. The result was only from a small
group of people in an urban area. Since people who live in rural area cannot
access to the internet and the geographic barriers also make them lose
connection from the city. As can be seen, there incomparable sample related to
location can lead to misleading statistics as well.
Reference:
Scheuren, F. (2004, June). What is a survey. Retrieved from
Alden, L. (2005, July). Statistics
can be misleading. Retrieved from
http://www.econoclass.com/misleadingstats.html
Author unknown, (2005). Survey design
[online] Available from:
http://www.surveysoftware.net/sdesign.htm[ accessed 27 october 2013]
Haney,B. (2011, May 13). Chapter1: our treacherous
tendency. Retrieved from
http://www.calvin.edu/academic/economics/faculty/bios/HaneyDocs/page-58952330.html
Essay Assignment: Asking Biased Questions
There are
many factors concerning understanding misleading evidences and statistics. One
in particular would be asking biased questions in order to get a biased answer.
Many enterprises and businesses in order to get a data or survey they intend,
favorably to their likings. Hence, it is essential that we learn to identify biased
questionnaires, and keep questioning the methods. There are six walkthroughs
and fundamental rules; we need to consider when it comes to analyzing data and
statistics. First of which is Understanding potential use of data. What we will
need to learn about this skill is to recognize the language of biased
questions, explain the size of sample effects. Secondly it is then identifying
the biased collection of data. It is often how to predict and identify how the
sample might be affected by the way it is chosen, the intention of the study of
the results, and determines when it can use to make general statements. The
rest of the skills involve figures that misrepresent its data, usages, and its
improper use of averages, and introducing opposing view of data. It is vital to
think and read critically when doing research, reading articles concerning
evaluation of data, graphs, or percentages. When it comes to graphs, readers
need to identify how the graph has been manipulated to give a certain
impression and to describe what the intention of the person who drew the graph
may have been.
The uses of statistics are indispensable in a multiplicity of specialties. It helps making decisions, predicting the results of the future or making estimation with a high level of confidence. However, once a statistic is misleading, misunderstanding might occurs. For instance, one misleading statistical interpretation occurred when tin helmet was initially introduced in the First World War. During that period, tin helmets were introduced in a bid to reduce the number of head injuries which were very high. By contrast, there was a dramatic increase in the number of head injuries. The issue remained indescribable until it was demonstrated that earlier records were accountable only for injuries not fatalities. The fact was that the number of fatalities fell dramatically, but injury numbers went up because the tin helmet saved their lives, while some soldiers were still injured (Misleading Statistics, Internet). As a result, that statistics should have been presented in more detailed, as the occurrence of misunderstanding directly caused by the deficiency of detailed information.
A poor or an unfair sample can lead to a misleading statistic. In other words, if the collection and analysis of data is not correctly arranged, it can mislead both the presenters and the readers. Internet polls are obvious examples. Those type of polls cannot be trusted or used in any official purpose, simply because the attendees or voters that are interested in the topic asked in that poll only would vote their ideas. Furthermore, the background information of those attendees areunknown. A poll or a survey takes effect when it shows clearly who are the participants including their ages, socio-economic statuses and other essential background, because that would assist the user in making a clear decisions without any reluctance but with a high degree of confidence. What is more, sometimes people just vote it for fun, so they do it without any contemplative consideration. Therefore, it is crucially important as a reader to find out these information ahead of putting faith in those polls.
Biased can leads from facts to false. Not that it doesn’t seem important but biased of statistics or research can result in undermine of the aim to change based on the result of research. The misuse or misunderstanding the statistic can give us a very wrong or distorted view of reality and can change one innocent or something to guilt and vice-versa. As the gun rules in America shows that it’s clear that gun should not be bought or should be held in a hand of anyone, especially student. But how reporters want us to view depends on if they’re being biased. Some reporters can persuade us that guns can be the protection in an attack and more chance survival the physical fights, but others can argue it is very dangerous and violent to everyone because anyone can shoots at any other person as long as they want, simply because they have gun. In contrast, the reports about 5 astronauts were killed. It was obvious that NASA was blamed because of its reliability. Those reports illustrated that the blame for not being reliable isn’t the first time for NASA. So that we all could trust and at least reporters didn’t sound biased at all.
Bibliography
(n.d.). (Telkom Foundation) Retrieved November 1, 2013, fromhttp://www.mindset.co.za/resources/0000042664/0000068826/0000076861/TG%20Manip%20Data_no%20rubric%20FINAL.pdf.
(n.d.). Retrieved 11 01, 2013, fromhttp://www.calvin.edu/academic/economics/faculty/bios/HaneyDocs/.
Misleading Statistics. (n.d.). Retrieved 11 01, 2013, fromhttp://www.suffolkmaths.co.uk/pages/Maths_in_the_World/Misleading%20Statistics/Some%20Examples%20of%20Misleading%20Statistics.doc.
News Biased. (n.d.). Retrieved November 1, 2013, from http://www.umich.edu/ ~newsbias/omissions.html.
Statistics should be
Interpreted with Caution as They can be Misleading
Numbers
are one of the most important tools to provide information for people.
Furthermore, numbers play a very crucial role in statistics. They are evidence
that can effectively strengthen any argument and persuade the audience to
change their opinions.Statistics can be used in many different fields such as
economics, politics and business. However, statisticsare not simple to decipher,
we cannot understand statistics by just looking at graphs, numbers and the data
shown. It requires a certain knowledge and skill to analyze statistics. During
the process of analysis, there are many possibilities that statistics can be
misleading, especially due to the mistake of presenter in interpreting it and
the presenter’s motive.
Manipulating
statistics is one of the common waysto mislead people by data. Manipulate means
to give the wrong idea for personal benefit. Authors, advertisers, businessmen
and politicians rely on surveys, polls and other statistics to make their points
of view appear more credible and trustworthy (LearningExpress Editors, 2011). Peopletend
to believe in statistics without making deepconsideration, sothis gives a
chance for the presenter to successfully deceive their audience.
First
of all, one way that misleading statistics can be seen is through the process
of running a business. The company tries to manipulate its product
advertisement in order to gain more customers that may lead to the boost of its
product’s sale. Misleading statistics in advertisements are seen as false
advertising or deceptive advertising because the publisher of statistics uses a
false or misleading statement in advertising to convince consumers into
commercial transactions that may benefit them. For instance, a case of
misleading statistics was depicted in Dannon, which is a well-known yogurt
producing company. This company claimed that their popular yogurt, Activia,
which was introduced in 2007, has a special bacterium proven to help strengthen
the consumers’immune system and regulate digestion in one’s body. Therefore,
the brand witnessed a dramatic increase of 30% premium in its annual profit in
selling price over other brands (WEINMANN and BHASIN, 2011). In 2008, a lawsuit
was filed by one of Dannon’s customer charging the company claims were false
and deceived the public into buying a yogurt that was expensive whilst its
quality wasa total lie. After settling in court, Dannon paid its consumers up
to 45 million dollars. Dannon also had to change its health claims for Activia by
removing the word “immunity” and “clinical studies show” from their advertising
phrase (MCMULLEN, 2010).
On
the other hand, money is not always the reason for pursuing misleading
statistics. Sometimes, it can be used in a more official purpose without any relation
to money. Some political parties manipulate their statistics to gain power,
trust and supporters during the election campaigns. In addition, in order to
maintain their images and positions in political parties, politicians use GDP
definition revision to hide their falling policies by rewrites the economic
statistics to make the public view their policies as successful. For instance,
one of the most obvious examples is the calculation of the GDP which was made
by Obama administration in which they exaggerated the GDP rates by 3%, while
the original GDP report illustrated the slow economic growth in less than 1
percentage. Some professional forecasting services expected the numbers to be
as low as 0.5 percentages and year by year the United States’ economic growth
seemed to barely grow byone percentage compared to a 2011-2012 which was
already tepid at 1.7 percentages. This led to the appearance of the recovery of
United States’ economy. In fact, in 2009 all other fiscal-monetary policies in
fact have failed to produce a sustainable recovery for the future of the nation
(RASMUS, 2013).
Last
but not least, some medical companies, in order to fulfill their targets,
without any considerations of innocent people life; they falsify the medication
advertisement, even though there is an obvious side effect which is a risk to
patients’ health. Medicine can prolong life and prevent people from suffering
disease but their marketing can be unsafe and sometimes deadly. For example,
Glaxo Smith Kline (GSK), which is a giant drug industry, has hidden information
regarding the effectiveness and bad side effect of their diabetic drugs,
Avandia to the public. As a result, this secrethave not gone unobserved, in recent
times, Santa Clara County in Northern California filed a lawsuit against GSK
for cover up evidence that Avandia optimizes the risk of heart attack.
Nevertheless, recent report of the Senate Committee indicated that the drug is
responsible for causing thousands of heart attacks, still all the accusations
have been denied by GSK and they continue to claim the FDA-approved drug is
safe. The Supreme Court announced that individual has the right to sue Drug
Company for great suffering which was caused by incompetent risk labeling on drugs
(Ethan A. Huff, staff writer, 2010).
In
conclusion, we can see that misleading statistics can be used in a variety of
fields in order to deceive diverse kind of audience. Misleading statistics can
be effectively used in both the economic fields and political fields because many
people still lack the abilities to critically think and assess the information
they received. Although some people are good at critically analyze information,
no one can always be alerted of the misleading statistics since we see them
everywhere, every day. Moreover,statistics for personal benefit have become a
controversy for many years and we believe that many people have been aware of
this kind of trick. However, clever advertisers still find ways to deceive
consumers in ways that are legal or technically illegal but unenforceable.So I
recommend everyone to be cautious of these kind of misleading statistics, even
though some facts seem to be true at first glance, we need to reconsider about
them multiple times to really see through the publisher’s trick.
Bibliography:
-
TROY MCMULLEN, (Feb 26, 2010). Dannon to Pay $45M
to Settle Yogurt Lawsuit
[Online]. ABC News. Available from:
[Accessed
29 October, 2013]
-
JACK RASMUS, (July 31,
2013). Economic Recovery by Statistical Manipulation [Online]. CounterPunch,
Tells the Facts and Names the Names. Available from:
[Accessed
29 October, 2013]
-
KARLEE WEINMANN and KIM
BHASIN, (SEP 16, 2011, 5:33 pm). 14
False Advertising Scandals That Cost Brands Millions [Online]. Business
Insider. Available from:
[Accessed
29 October, 2013]
-
LearningExpress
Editors, (Sep 19, 2011). Manipulating Statistics Study Guide, Manipulating
Surveys [Online]. Education. Available from:
[Accessed
30 October, 2013]
-
Ethan A. Huff, staff writer, (Thursday, June 03, 2010). California County sues Glaxo for false
advertising of Avandia drug [Online]. NaturalNews. Available from:
[Accessed
30 October, 2013]
No comments:
Post a Comment